



On this page0%
For many researchers, the chromatogram is one of the most recognizable features of a Certificate of Analysis. Rows of data, analytical results, and technical specifications often accompany it, but the chromatogram itself tends to attract the most attention. Peaks, percentages, retention times, and unfamiliar labels create the impression that something important is being displayed, even if the details are not immediately obvious.
Yet despite appearing on countless analytical reports, chromatograms are frequently misunderstood. Some readers assume they represent purity directly. Others interpret them as proof of identity. In reality, a chromatogram is neither a purity percentage nor an identity certificate — it is a visual representation of analytical data generated during a chromatographic separation process.
Understanding what a chromatogram shows, and equally important, what it does not show, is an essential skill when evaluating analytical reports.
What Is a Chromatogram?
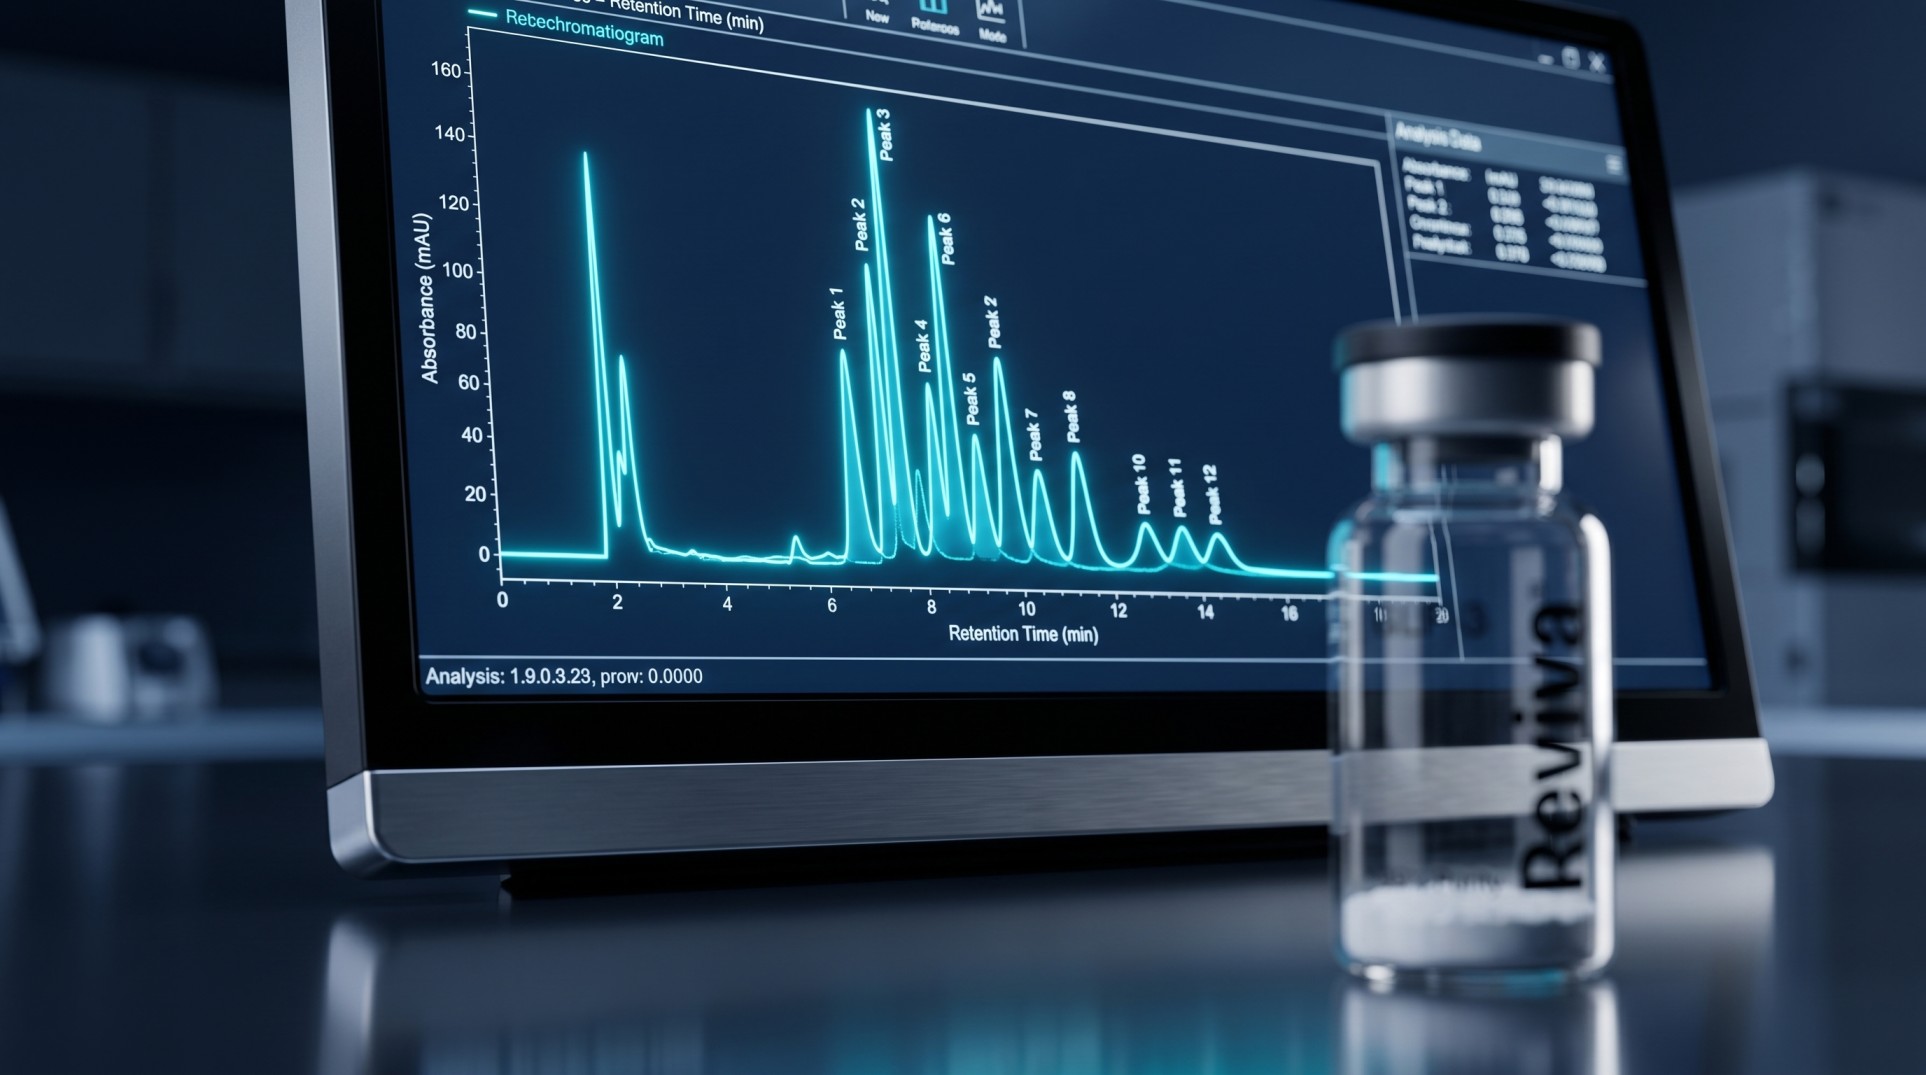
A chromatogram is a graphical output produced by chromatographic techniques such as High-Performance Liquid Chromatography (HPLC).
During analysis, components within a sample are separated as they move through a chromatography system. As these components pass through the detector, signals are recorded and displayed as peaks on a graph. The resulting chart is the chromatogram.
At its simplest, a chromatogram is a visual record of what the instrument detected over time. Rather than displaying molecules directly, it displays detector responses corresponding to materials moving through the system. Each peak represents a detected component within the sample.
Understanding the Axes
Most chromatograms contain two primary axes.
The horizontal axis represents time — often referred to as retention time, which indicates when a particular component reaches the detector after passing through the analytical system.
The vertical axis represents detector response. Higher peaks generally indicate stronger detector signals, although peak height alone does not necessarily determine concentration or purity.
Together, these axes create a visual map of how the sample behaves during analysis. The position of a peak helps identify when a component was detected; the size of a peak helps estimate its relative contribution to the overall sample.
- Main PeakThe target peptide — tall, sharp, well resolved.
- Impurity PeaksSmaller related species: truncations, oxidations, by-products.
- Peak AreaIntegrated area under a peak — proportional to quantity.
- Baseline & Retention TimeA stable baseline and each peak's elution time anchor the result.
Illustrative trace — the dominant peak is the target peptide; its area as a share of all peak area is the purity figure.
Why Peaks Appear
A common misconception is that a chromatogram should contain only one peak. In reality, most samples contain multiple detectable components. Even highly purified materials may produce additional signals resulting from minor impurities, residual compounds, degradation products, or analytical artifacts.
As individual components travel through the chromatography system, they separate and emerge at different times. This separation creates distinct peaks on the chromatogram.
The goal of chromatography is not necessarily to eliminate every peak except one. The goal is to separate components clearly enough that they can be evaluated individually. Well-resolved peaks generally allow analysts to interpret data more effectively.
The Main Peak
In many analytical reports, one peak is noticeably larger than the others. This peak often corresponds to the primary compound being evaluated, and its relative size compared to surrounding peaks can provide useful information about sample composition.
However, the largest peak should not automatically be interpreted as proof of identity. A chromatogram can suggest the presence of a major component, but confirming exactly what that component is may require additional analytical techniques.
Chromatography helps separate and visualize components. Confirming identity often requires another instrument entirely.
This distinction matters, and it is explored in depth in Purity vs Identity: separation and visualization are one job; identity confirmation is another.
Peak Area vs Peak Height
Researchers frequently notice both peak height and peak area reported on analytical data. While peak height reflects the maximum detector response, peak area measures the total signal generated throughout the peak.
In most analytical applications, peak area is considered more meaningful, because the total area better reflects the amount of material contributing to the signal. A taller peak does not always represent more material than a broader peak. For this reason, purity calculations often rely on peak area percentages rather than peak height alone.
What Chromatograms Can Tell Us
When interpreted correctly, chromatograms provide valuable analytical information. They can help researchers understand:
- Relative sample composition
- Presence of detectable impurities
- Peak separation quality
- Analytical consistency
- Overall chromatographic performance
A chromatogram offers a visual perspective that numerical data alone cannot always provide. Patterns, peak shapes, and separation quality often reveal useful information about the sample and the analytical process — which is one reason chromatograms are frequently included alongside Certificates of Analysis.
What Chromatograms Cannot Tell Us
Chromatograms are powerful tools, but they are not complete analytical reports. A chromatogram alone does not automatically confirm:
- Molecular identity
- Biological activity
- Stability under all conditions
- Absence of every possible impurity
- Overall product suitability
Analytical testing is most effective when multiple techniques are considered together. Chromatography provides one source of evidence; other methods — such as mass spectrometry for identity confirmation — contribute additional information, as part of the broader toolkit of analytical methods. A complete quality assessment rarely relies on a single graph.
Why Chromatograms Appear on Certificates of Analysis
Including chromatograms on Certificates of Analysis increases transparency. Rather than presenting only summary numbers, laboratories can provide researchers with access to the underlying analytical output.
This allows readers to evaluate the quality of the separation process and understand how reported results were generated. For experienced analysts, chromatograms provide context beyond numerical specifications; for newer researchers, they offer an opportunity to better understand the analytical methods supporting quality assessments. In both cases, transparency strengthens confidence in reported data — the same principle behind independent, third-party testing.
Looking Beyond the Peaks
The value of a chromatogram extends beyond individual peaks — it represents a snapshot of analytical performance. When viewed alongside purity data, identity testing, and other quality metrics, it contributes to a broader understanding of sample quality. You can see this in practice on a product page such as GHK-Cu or BPC-157, where the chromatogram sits beside separately sourced purity and identity results.
The most informative analytical reports combine multiple forms of evidence rather than relying on a single result. A chromatogram is one piece of that puzzle, and understanding how to interpret it helps transform a complex-looking graph into a meaningful source of information.
Key Takeaways
- A chromatogram is a graphical representation of analytical data generated during chromatographic separation — not a purity percentage or an identity certificate on its own.
- Each peak represents a detected component; the horizontal axis is retention time and the vertical axis is detector response.
- Most samples produce multiple peaks; the goal is clear separation, not a single peak.
- Peak area is generally more meaningful than peak height, which is why purity figures rely on area percentages.
- Chromatograms support assessment of composition, impurities, and separation quality — but a complete quality picture combines them with other methods.